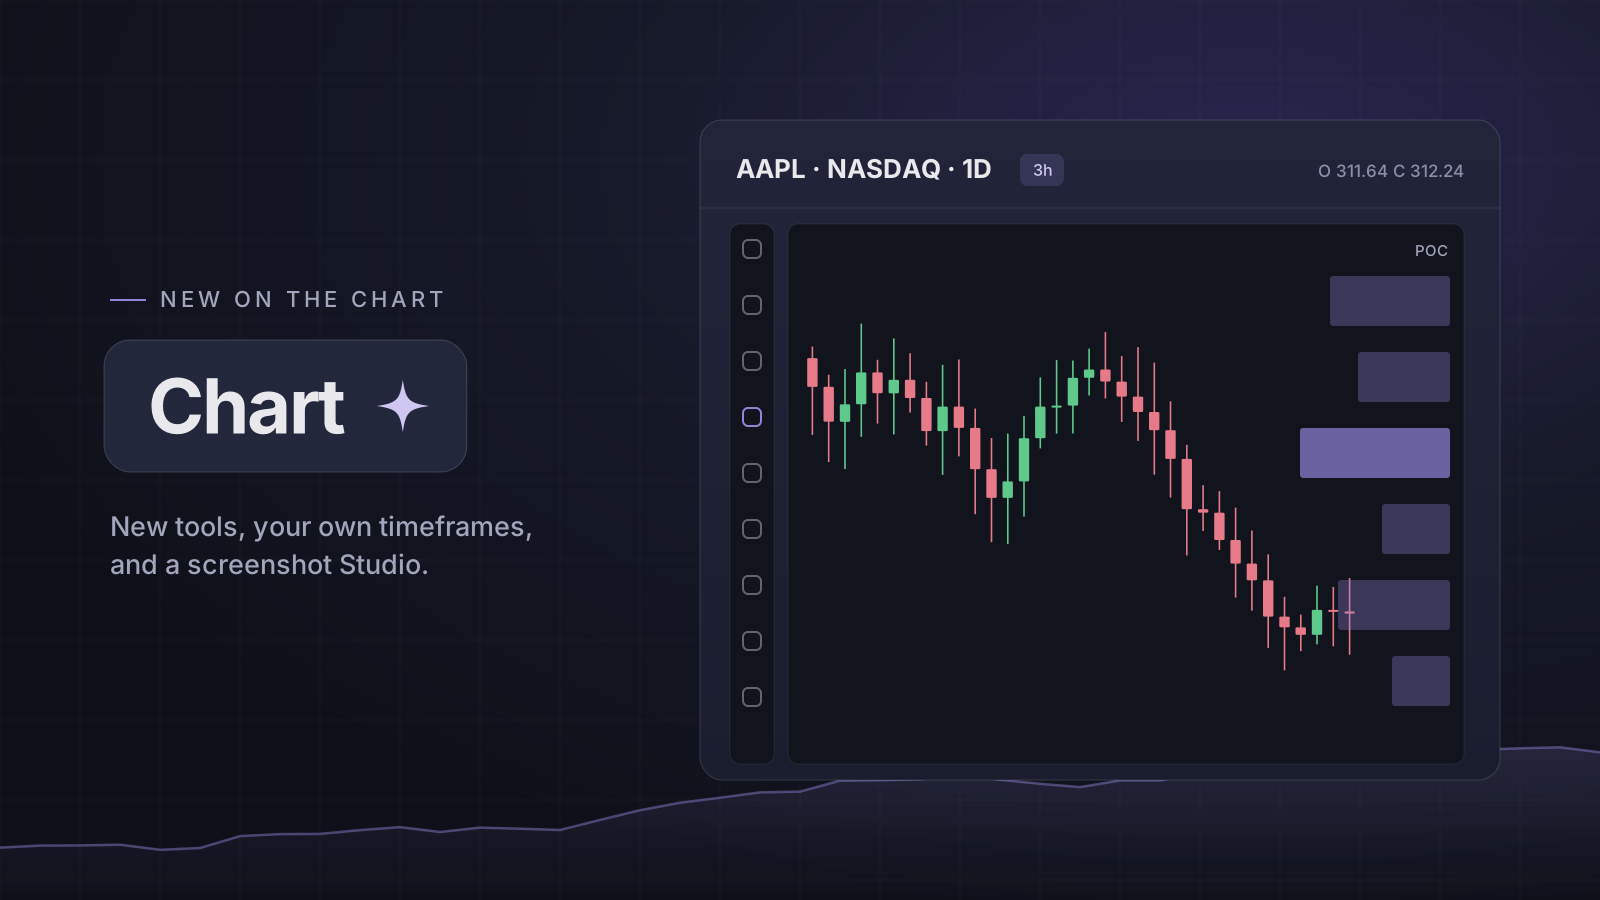
Seventeen new tools on the rail
Hover a button on the rail and its whole menu opens. Brush and Highlighter draw with a drag, and there are arrow marks, an ellipse, a rotated rectangle, Polyline and Path.
Text gets its own family: Callout, Note, Price note, Comment, Price label and Signpost. Beside the position tools sit Date & price range, Anchored VWAP and Fixed range volume profile, which read the candles under them.
Your timeframes, not ours
The arrow after the timeframes opens the full list. Star the ones you want on the bar, and take the star off the ones you do not. Type any other, like 22m, 3h or 2D, and press Enter to chart it.
The same indicator, as often as you like
A row in the Indicators menu now adds one each time, up to 8, so two moving averages with different inputs is one click more than one. The legend shows just the name and the value; hover a row for its options.
Each indicator has a proper settings window: its inputs, the colour, thickness and line style of each plot, what the legend shows, and the timeframes it appears on.
A screenshot worth posting
Select portion in the camera menu lets you drag out the part of the chart you want. The Studio then redraws it to the shape you pick, 16:9, 3:2, 1:1 or 9:16, on a backdrop in our colours, with your drawings and large prices. Or use Download PNG to save the chart as it is, straight away.
Smaller things you will notice
There are 8 uneven layouts under the layout grid, and a double-click gives one chart of a split the whole space until you double-click it again. A right click on the chart offers an alert at that price. Alt + I flips the chart. The price at your cursor runs along the price scale, big volumes read 8.52M, and the chart's prices are in the same type as the rest of the app.
Which plans
Saved drawings are part of Essential and Pro. Splits follow your plan's 2 or 4 panes, so the uneven layouts, which hold three or four charts, are on Pro. Timeframes, indicator settings and the Studio are on every plan.
Open it: Chart
Open in the app