The heatmap
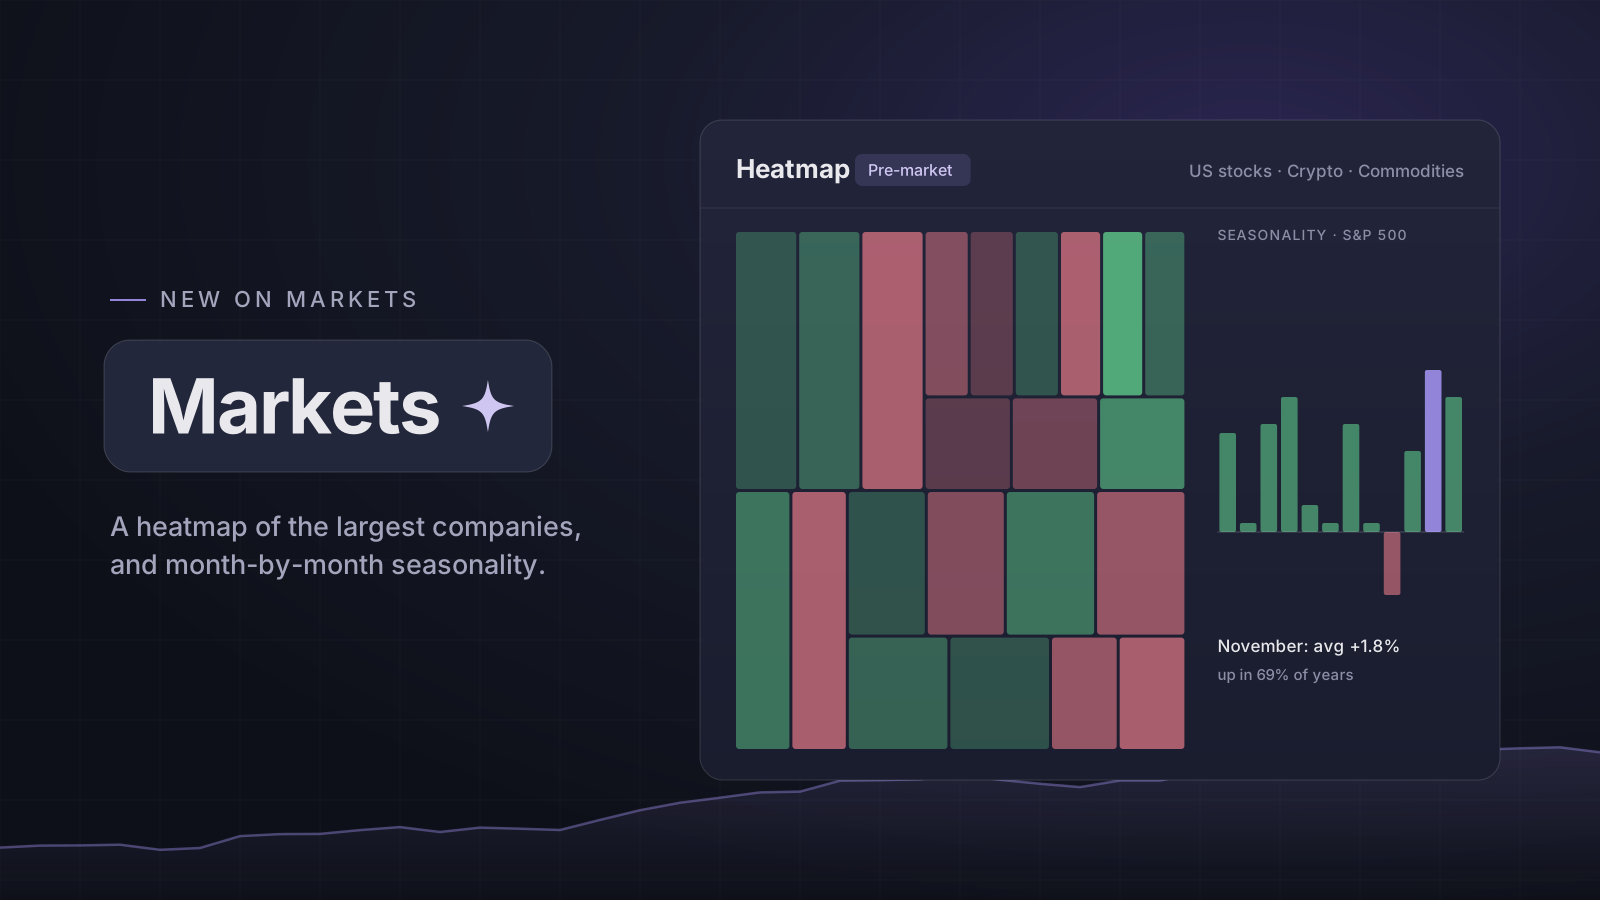
Markets has a Heatmap view: the largest US companies grouped by sector, each tile sized by market cap and coloured by today's move. Hover a tile for its figures, and click it to open the chart.
Switch between Regular, Pre-market and After-hours to recolour the same tiles by that session. A company that has not traded in the session is grey, never its regular change.
Zoom, one sector, and two more maps
Scroll or pinch to zoom where you point until the small tiles show their tickers, and drag to move. Click a sector's name to see it on its own. Above the map, switch to Crypto, the largest coins, or Commodities, the main futures sized by the money in them.
Seasonality
The Seasonality view shows the average return of each calendar month for the S&P 500, the Nasdaq 100, the Russell 2000, gold and bitcoin, each over its own history. Hover a month for its median, how often it rose, and its worst and best year. Compare puts several on one chart. It is history, not a forecast.
Open it: Markets
Open in the app